Thursday, February 16, 2012

Igneous Rock: Obsidian

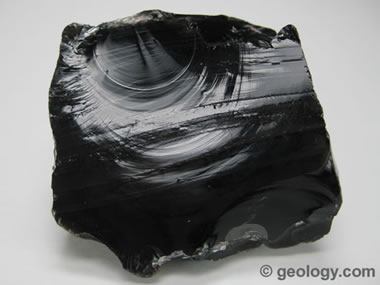
For my igneous rock, I chose obsidian because I have a few pieces at my house. You might know obsidian as "volcanic glass." Obsidian forms when lava cools at a rapid pace and prevents the formation of crystalline structures. It is generally an extrusive rock but can form as an intrusive rock in certain situations. It displays a conchoidal fracture when broken.


This is an image of lava cooling and forming obsidian.


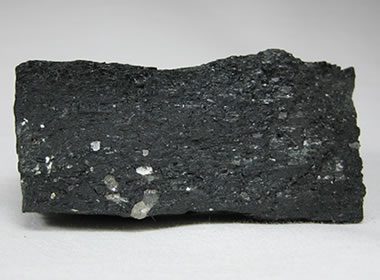
Even though obsidian is black in most cases, it can also appear green or brown. In a low number of cases, obsidian can appear blue, red, yellow, and orange, and it can contain a mixture of colors. 

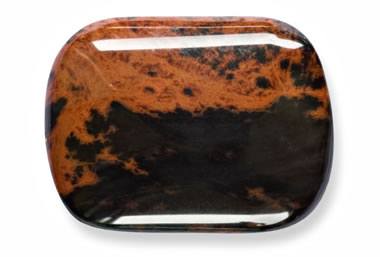
This particular piece of obsidian was shaped and smoothed into a jewelry stone and carries a mixture of color. In many pre-modern cultures, people used obsidian to create cutting tools and spearheads, as well as jewelry.  


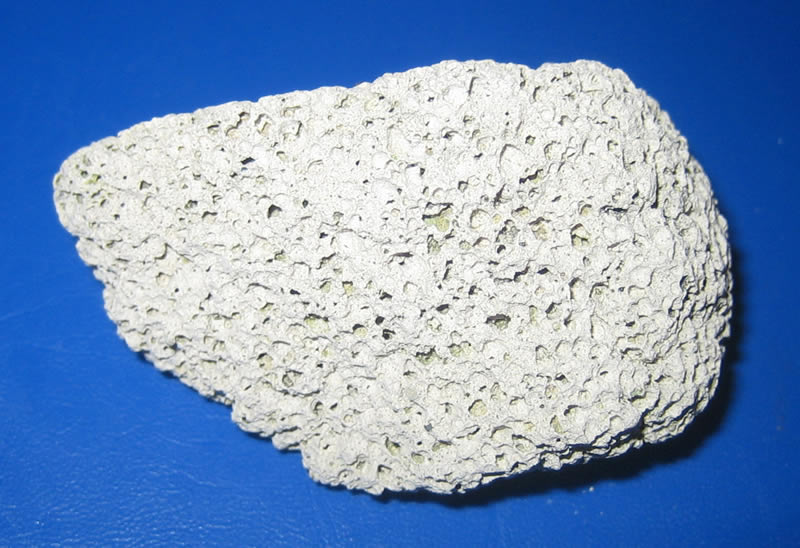
Obsidian is abundant in areas of recent volcanic activity, such as Canada, Argentina, Peru, Russia, Greece, the United States, and several other locations. In the United States, obsidian is not present east of the Mississippi River due to the absence of volcanic activity. The picture of an obsidian deposit featured above was taken in Oregon.


These two images were also taken in Oregon, although in a different location. They display what is called the "Big Obsidian Flow" that resulted from an eruption of the Newberry Volcano in central Oregon around 700 C.E. 

If you would like to check these facts or learn more about obsidian, you can visit the following website:  http://geology.com/rocks/obsidian.shtml 

Wednesday, February 8, 2012

Lab 3: Identification

Since a lab later in the semester requires us to identify a number of minerals, I decided to include pictures of all the ones we identified in class last Thursday. Hopefully, all the pictures will be useful when studying.

Potassium Feldspar

Kaolinite

Obsidian

Quartz
On a side note, Quartz is the official state gem of Georgia. The state legislature designated it as such in 1976, specificially citing amethyst and clear quartz as examples.

Hornblende


Halite

Pumice

Micah

Amethyst
 

Galena

Limestone


Calcite


Wednesday, February 1, 2012

Lab Two: Mapping Excercise

I tried to make my Isarithmic Map colorful and informative. My coloring and line-drawing skills are not always the best, but hopefully the contour lines are visible.

This is an example of a Choropleth Map. In this particular map, the data shows the percentage of people 65 and older in the United States. Of course, Florida has one of the highest percentages.

For my Isarithmic Map, I chose one which shows the average temperatures in North America and The Caribbean. The table explains that the bands show temperature in ranges of five degrees Celsius. In addition, the map shows the highs for the afternoon and lows for the night in several major cities, and it shows possible weather conditions in certain regions.

This is a combination of a Choropleth and Proportional Symbol Map. The color-code system provides a representation of mean ACT scores, and the symbol-system shows the participation of college bound seniors in 2009.

This Dot Density Map supposedly represents every McDonald's in America, with each McD's having its own dot. I'm not sure if this is completely accurate, but it makes sense.

This is an additional example of a Dot Density Map. The map displays the population of Alabama with symbols of varying size and color.